Statistics Ch 2 Graphical Representation of Data 1 of 62 Types of Graphs
👁 10 مشاهدات

 6:22
Statistics Ch 2 Graphical Representation of Data 33 of 62 Standard Deviation With Sample Data
Michel van Biezen
1.9K مشاهدة · 6 years ago
 4:20
Statistics Ch 2 Graphical Representation of Data 10 of 62 Classes Groups
Michel van Biezen
6.4K مشاهدة · 6 years ago
 0:56
Top 7 Types Of Statistics Graphs For Data Representation
StatAnalytica Learn Statistics
59 مشاهدة · 6 years ago
 4:24
Statistic Ch 2 Graphical Representation of Data 61 of 62 How to deceive with statistics Ex 3
Michel van Biezen
1.4K مشاهدة · 6 years ago
 1:46
Statistics Ch 2 Graphical Representation of Data 57 of 62 The Upper and Lower Hinge
Michel van Biezen
1.5K مشاهدة · 6 years ago
 3:09
Statistics Ch 2 Graphical Representation of Data 60 of 62 How to deceive with statistics Ex 2
Michel van Biezen
1.2K مشاهدة · 6 years ago
 2:42
Statistics Ch 2 Graphical Representation of Data 2 of 62 The Pie Chart Circle Graph
Michel van Biezen
28.7K مشاهدة · 6 years ago
 22:54
Graphical Representation of Statistical Data SS 2 JAMB Tutorial WAEC NECO Post UTME etc
Klacify Academy
605 مشاهدة · 2 years ago
 2:47
Statistics Ch 2 Graphical Representation of Data 59 of 62 How to deceive with statistics Ex 1
Michel van Biezen
1.3K مشاهدة · 6 years ago
 10:26
statistics Graphical representation of data and graph types
Advance Statistics
700 مشاهدة · 3 years ago
 1:50
Statistics Ch 2 Graphical Representation of Data 3 of 62 The Bar Graph
Michel van Biezen
16.2K مشاهدة · 6 years ago
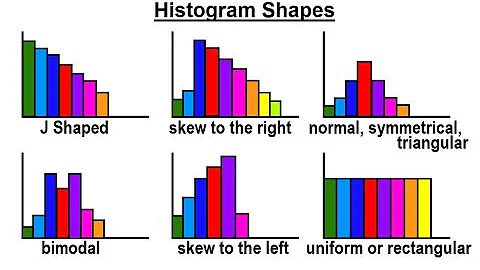 2:54
Statistics Ch 2 Graphical Representation of Data 14 of 62 Histogram Shapes
Michel van Biezen
10K مشاهدة · 6 years ago
 3:01
Statistics Ch 2 Graphical Representation of Data 37 of 62 Measure of Posistion
Michel van Biezen
1.5K مشاهدة · 6 years ago
 4:52
Statistics Ch 2 Graphical Representation of Data 17 of 62 Mean or Average
Michel van Biezen
3.5K مشاهدة · 6 years ago
 3:32
Statistics Ch 2 Graphical Representation of Data 34 of 62 Chebychevs Theorem
Michel van Biezen
2K مشاهدة · 6 years ago
 2:22
Statistics Ch 2 Graphical Representation of Data 5 of 62 The Stem and Leaf Display
Michel van Biezen
15.5K مشاهدة · 6 years ago
 3:56
Statistics Ch 2 Graphical Representation of Data 58 of 62 Z Score Standard Score
Michel van Biezen
1.3K مشاهدة · 6 years ago
 4:35
Statistics Ch 2 Graphical Representation of Data 28 of 62 What is Standard Deviation
Michel van Biezen
2.4K مشاهدة · 6 years ago
صفحات ذات صلة


